DS4A
a multidimensional index that helps determining government investments in internet connectivity

In the context of the course Data Science 4 All 2020, me and my team of 5 (Team-49) worked during 2 months to create the following project. Here’s an 8min video explaining our context, strategies and final proposition:
The Colombian Ministry of Information Technologies and Telecommunications (MINTIC) is the entity in charge of the design, adoption and promotion of politics, plans, programs and projects in the field of information and communication technologies. Within those functions, there is one to increase and facilitate access to these technologies for all inhabitants of the national territory. Currently, the network connectivity percentage for Colombian household is around 52,7%. This rises one of the challenges that this entity has, which is that at least 70% of households have internet connection. This could be done through deploying the network infrastructure to the all of the non-connected places. However, deploying networks it is an expensive labor that depends greatly on the government who is in charge of guaranteeing the infrastructure.
The importance of network deployment relies in the fact that it allows to develop the digital transformation that the country needs. Some of the key reasons for this include: not delaying economic and social development, improving the life quality of the population, granting access to academic platforms at home, virtual meetings, e-commerce, news outlets, among others. Additionally, with the current pandemic situation, one of measures to reduce the chance of contagion is to reduce the physical contact between people to the minimum. Nevertheless, the alternatives for this measure must not affect the economic indicators and the unemployment rate. According to this, the continuity of social, academic, economic activities relies in that the development of this activities must occur in a virtual way; to this effect, the connectivity must be guaranteed for most of the households in the national territory. To accomplish this task, the ministry requires:
-
To know the current situation, how many accesses to landline internet are there per town. Knowing that the connectivity is of 52,7%, the action plan can be oriented to increase coverage.
-
To know per town the closest infrastructure, which make more feasible to make a connection. Installing a connection in each town would be expensive due to the length of installation, therefore, it should be known the nearest infrastructure and suggest from there an initial connection. Also, it is important because it helps to reduce the installation costs; besides, the installation can be done as a priority.
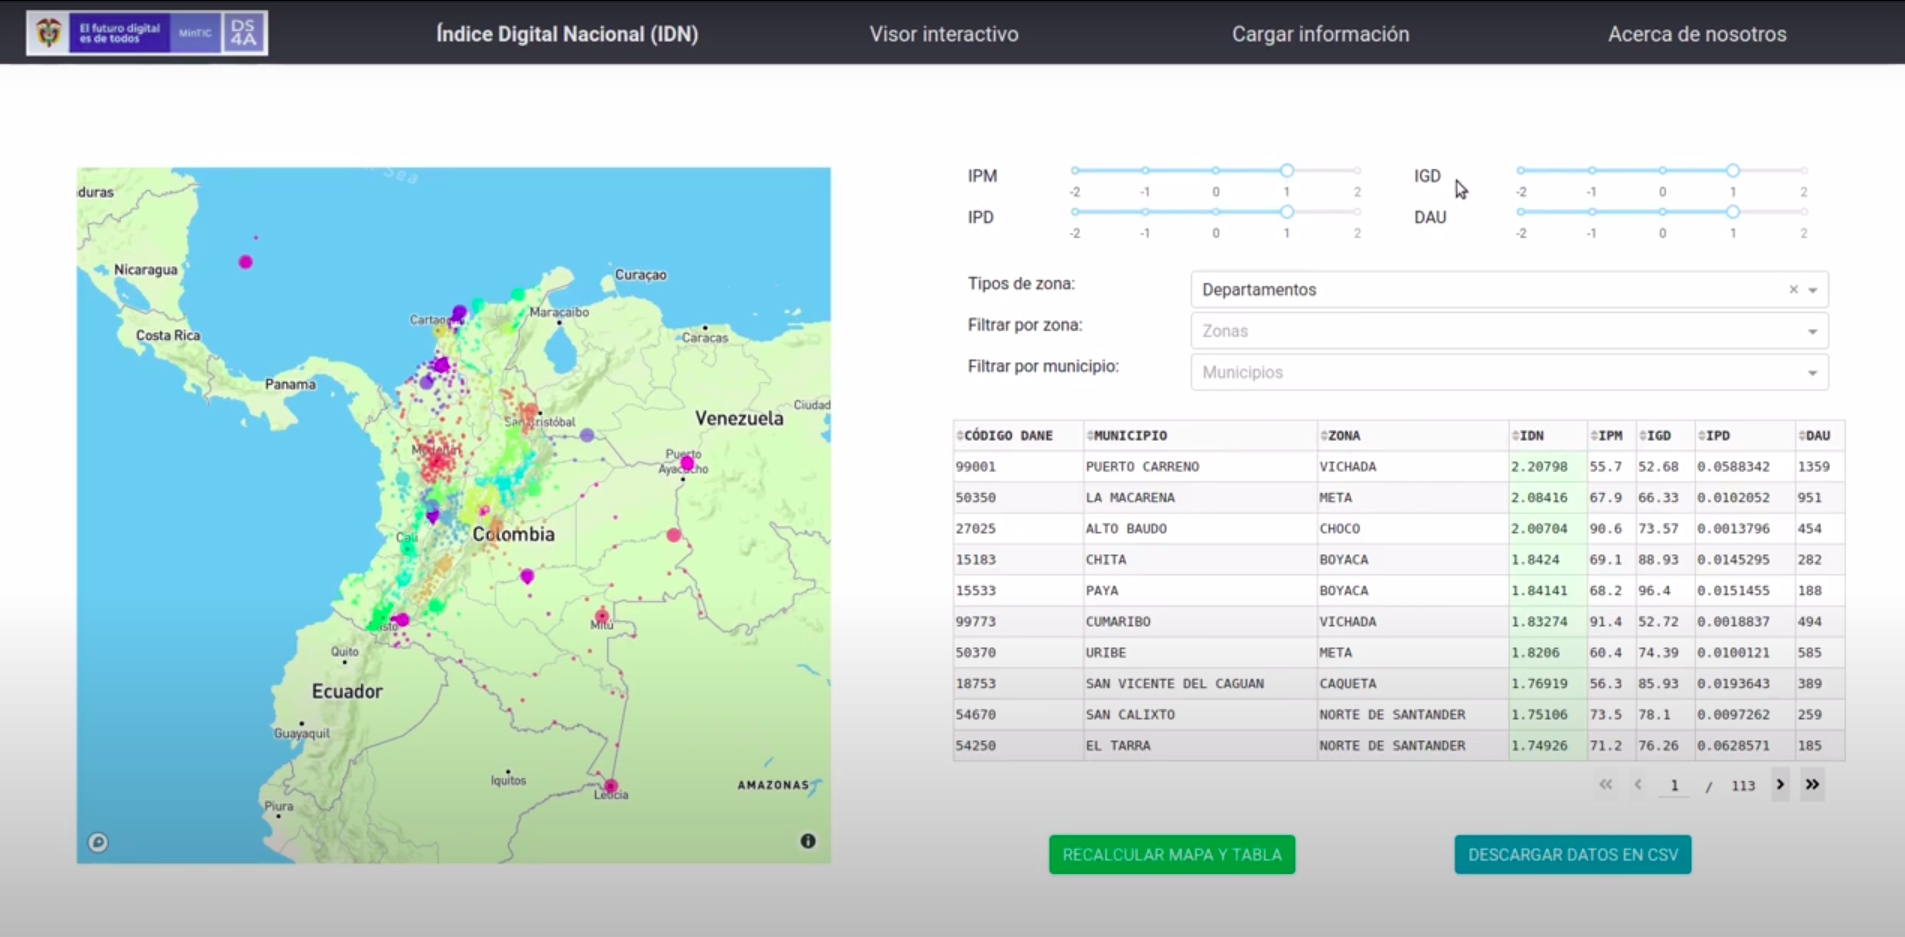
For this, Team-49 offers a dashboard webapp that helps to prioritize, in an objective way, the town that suits better for a possible network connectivity investment and provides a map visualization of those towns. This is calculated through an index created by the team, this index is the National Digital Index (Shortened as IDN which is the abbreviation in Spanish). It represents the preparation that a town has to have internet connection and it is composed of four indicators previously selected:
-
Multidimensional Poverty Indicator-IPM (In Spanish: “Índice de Pobreza Multidimensional”): This indicator comes from a 2018 census done by DANE, the Colombian department of national statistics. It is calculated with 15 indicators that consisted in 5 items: educational condition in the households, childhood conditions, employment, health and living conditions and access to public services.
-
Digital Governance Indicator-IGD (In Spanish: “Índice de Gobierno Digital”): Indicator calculated by MINTIC in 2018 in a national level.
-
Digital Penetration Indicator-IPD (Índice de Penetración Digital): This indicator is the ratio between the number of internet subscribers and the population for a given town in 2018. It takes values between 0 and 1.
-
Urban Area Distance-DAU (Distancia a Área Urbana): It is the road distance to the nearest urban center in kilometers. This is calculated by an algorithm developed by the team using Google’s API.
This index is calculated like a linear combination of the normalized values of the indicators above. The weight attributed to each indicator can be modified to prioritize some elements.